gold · silver · market
The Gold-Silver Ratio Just Snapped Back to 70. Here's What That Means
Silver's ratio to gold blew out from the mid-40s to 70 in six months. That's the market correcting a trade that got ahead of itself.
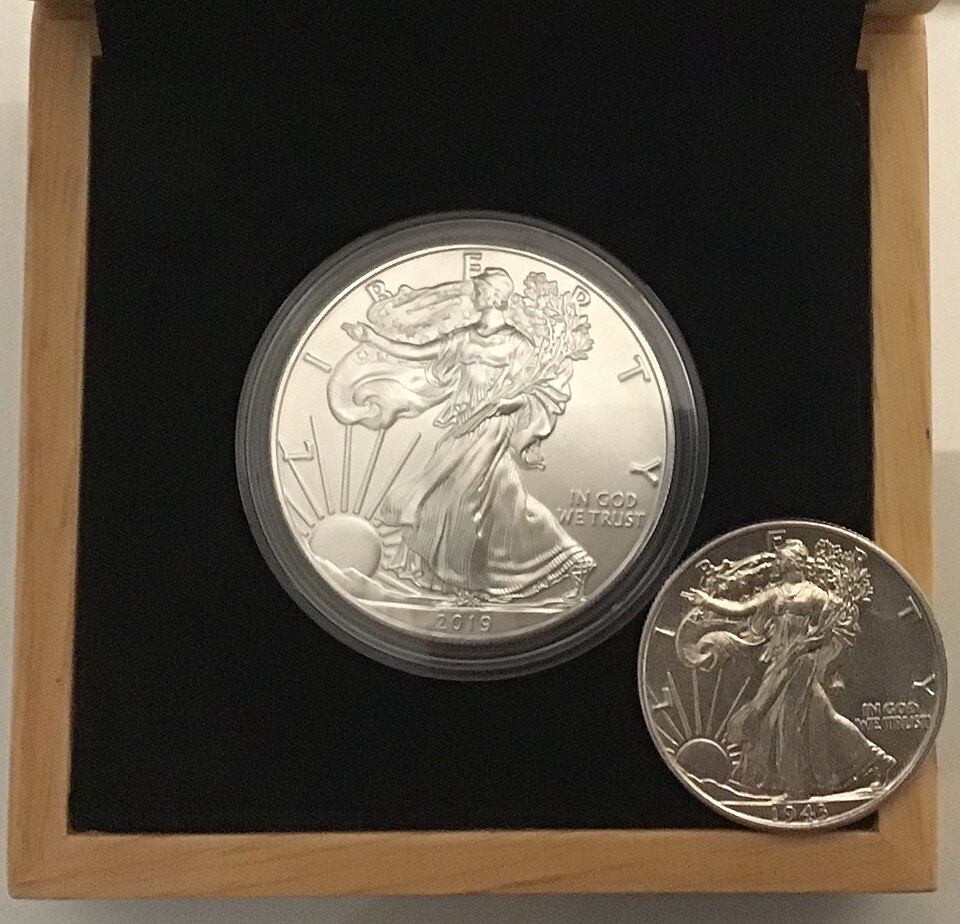
In late January, one ounce of gold bought you 50 ounces of silver — a 14-year low for the ratio. This week it buys you 70. That’s not a rounding error. That’s the market yanking the leash back on the hottest trade of the year.
Gold is sitting around $4,120 this morning. Respectable. Boring, even, by 2026 standards. Silver is at $58 to $59 — down roughly 52% from the $121.64 peak it touched on January 29. Both of those things are true simultaneously, which is exactly why the ratio between them is the number that actually matters right now, not either price in isolation.
The Ratio Doesn’t Lie, Even When You Want It To
The gold-silver ratio is just gold’s price divided by silver’s — how many ounces of silver it takes to buy one ounce of gold. It compressed to 50 in late January, the tightest it had been in fourteen years, as silver mania pulled retail money in faster than the metal could be mined or delivered. That was the market pricing silver like it was about to close the gap with gold permanently.
It didn’t. The ratio has since widened back out to around 70, meaning silver gave back a much bigger chunk of its gains than gold did. That’s what happens when a trade built on momentum meets a trade built on a printing press and a balance sheet. Gold’s rally has a boring, durable engine: central banks buying, real rates uneasy, a dollar nobody fully trusts. Silver’s January spike had that same engine plus a turbocharger of speculative leverage strapped on, and turbochargers blow first.
Iran Headlines Move Gold. They Barely Touch Silver
Watch the two metals on any given day this week and you’ll see the split. Trump says something about Tehran, gold pops a war premium and gives it back twelve hours later depending on his next sentence. Silver mostly shrugs, moving on its own schedule. That’s because silver isn’t really a fear trade. It’s half industrial metal, tied to solar, EVs, and the data centers running whatever chatbot you used this morning, and that demand doesn’t care what Trump posts.
The ratio blowing back out to 70 is really just the market re-separating those two stories after January briefly, and incorrectly, treated them as one.
What This Means for Stackers
A ratio of 70 is still historically rich — the long-run average since 1971 sits around 60, and silver bulls will point out that even after this snapback, one ounce of gold still buys you meaningfully more silver than history says it should. If you’re the type who swaps metals at extremes, this is a real signal, not noise.
But most of you reading this aren’t ratio traders, and you shouldn’t start now. You’re buying ounces on a schedule, and trying to call the next leg of a ratio that just moved 40% in six months is a good way to sit in cash waiting for a top that already happened. Keep the recurring buys running across both metals. The ratio is a compass, not a stop sign.
Sources
- Gold-Silver Ratio | History, Uses, Chart, & Trading Strategies — Britannica Money
- Silver Price Outlook June 2026: The Correction Was the Setup — GoldSilver
- Central bank gold statistics: June 2026 — World Gold Council