gold · silver · news
The Gold-Silver Ratio Fell to 71. Silver Is Still Less Than Half Its January Price.
Silver outpaced gold for two sessions and the ratio slid from its annual high near 74. Don't mistake a bounce for a recovery.
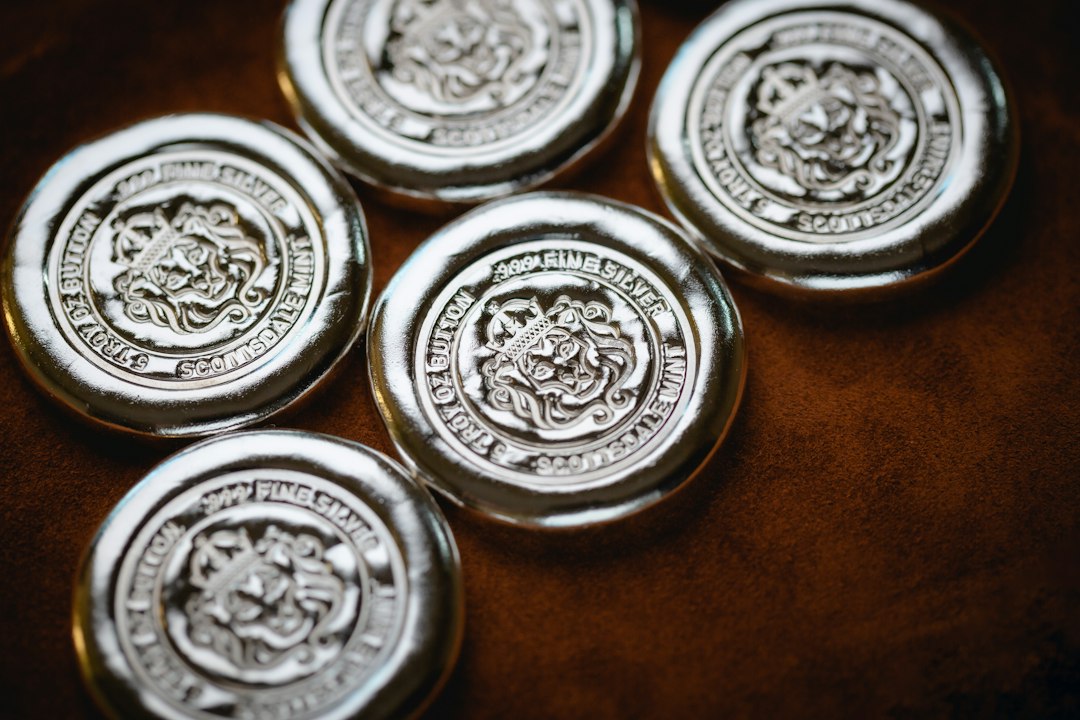
Silver rose for a second straight session on Tuesday, gold fell for a third, and the gold-silver ratio dropped nearly 2% to 71.11. If you stack silver, that sounds like good news. It’s a rounding error.
What Actually Moved
Gold closed Tuesday at $4,130, down 0.43%. Silver futures closed at $58.14, up $0.91, or 1.59%. The ratio, which touched an annual high near 74 last week, slid back to 71.11. A falling ratio means silver is doing better than gold. It did. For two days.
Now zoom out. Gold is more than 20% below its January record above $5,600. Silver is under half of its January record above $121. Same crash, but silver took the heavier hit. A 2% ratio move is a pothole on that road.
The Support Level That Cracked
Heraeus noted this week that silver broke below roughly $60 support and briefly approached its July low near $55 before recovering above $57. Their read: the break leaves the technical picture weaker. Early Wednesday, silver was back down 0.64% at about $57.51, while gold was up 0.31% near $4,136.
Translation: the bounce hasn’t repaired anything. Silver is sensitive to real yields and rate expectations, and rate expectations are not friendly.
The Backdrop Hasn’t Changed
Brent crude is back above $110 a barrel. September CPI ran 3.7% year over year. The Fed raised rates by a quarter point in September, and CME FedWatch has about an 83% chance of no change at the October 27-28 meeting. Traders still put roughly a 94% probability on a higher rate by December 9. Silver also carries an industrial-demand worry on top of the rate pressure, which gold doesn’t.
Even the bulls are trimming. CIBC cut its gold forecasts this week, though it still sees a 2027 average of $5,200. It cites central banks and record ETF inflows. Gold, in other words, has a story. Silver has a ratio.
What This Means for Stackers
I’ve made this mistake: reading one good week as a trend change and feeling clever for about nine days. Don’t.
The ratio is a useful yardstick, not a signal. It’s lower than last week’s annual high, and that’s all it is. If you buy silver on a schedule, $58 is less than half of January’s price. That’s a fact, not a forecast. What happens next depends on the Fed meeting next week and where oil goes. Watch those two, not the ratio.
Sources
- Gold falls for a third straight session as silver extends gains and the gold-silver ratio slips — Kitco
- Gold and silver prices pressured by hot inflation, but gold ETF holdings hit 2026 highs — Heraeus (via Kitco)
- Gold gains, silver slips as oil prices rise, Fed rate hike expectations persist — Kitco
- CIBC slashes gold price forecasts but sees recovery to $5,200 in 2027 — Kitco